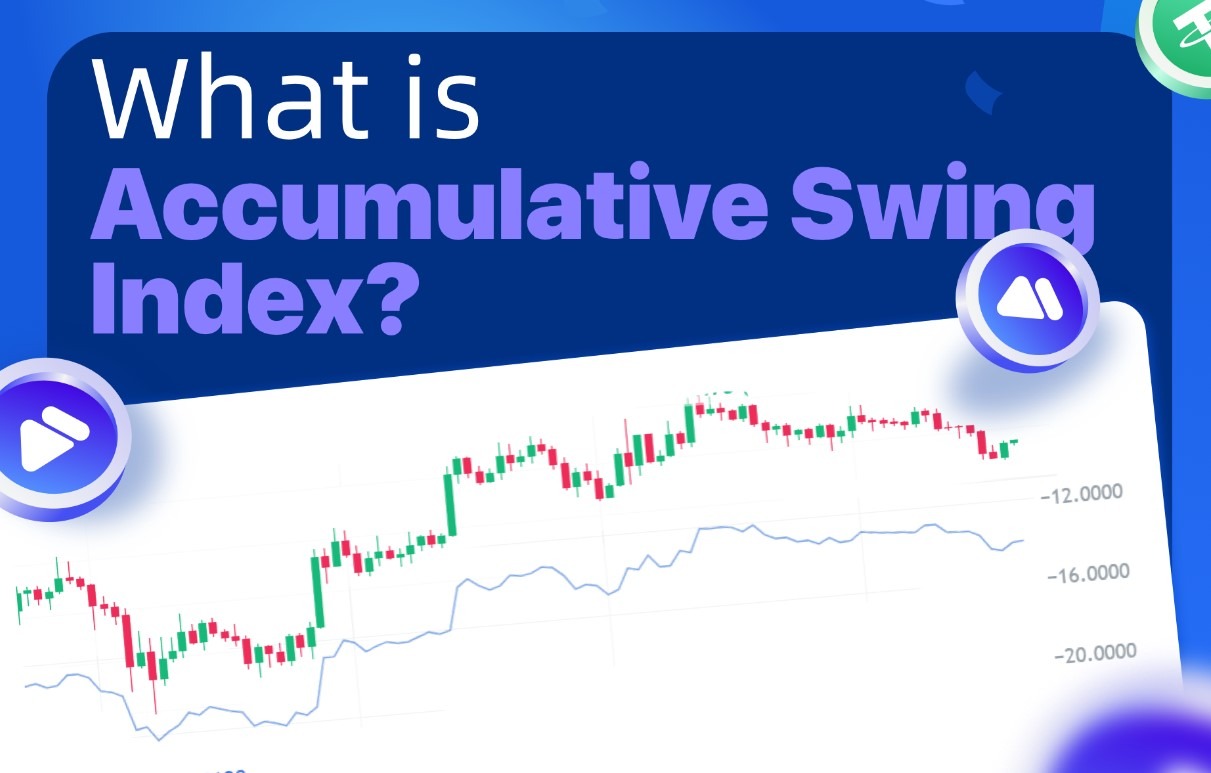
The Accumulative Swing Index is a trendline indicator that determines the price value over a certain period.
Developed by Welles Wilder, the Accumulative Swing Index tells the difference between the opening and closing prices. The ASI analyses opening, high, low, and closing prices for the current and previous trading sessions.
It is a modified version of the Swing Index and suggests values between 100 and -100 for positive and negative trends.
What is the Accumulative Swing Index Indicator formula?
The formula for the Accumulative Swing Index indicator is
SI = 50 x (Cy – C + ½ (Cy−Oy) + ¼ (C-O) x K/T
__________________________________________
R
Where;
C = Today’s closing price
Cy = Yesterday’s closing price
H = Today’s highest price
Hy = Yesterday’s highest price
K = the larger of Hy−C, and Ly−C
L = Today’s lowest price
Ly = Yesterday’s lowest price
O= Today’s opening price
Oy = Yesterday’s opening price
R = Varies based on the relationship between C, Hy, and Ly
T= the maximum amount of price change for the day
How to calculate the Accumulative Swing Index Indicator?
To calculate the Accumulative Swing Index indicator, you need to follow certain steps.
First, you need to calculate today’s open, high, low, and close.
Secondly, you have to calculate yesterday’s open, close, high, and low.
After finding the values, you have to find the difference between the maximum of today’s high/close and yesterday’s close to find the value of K.
Then, you have to find the difference between the maximum of today’s high and yesterday’s close, today’s low and yesterday’s close, and today’s high and today’s low to find the value of R.
Finally, you have to find the value of T by finding the maximum amount of price change for the day.
Best settings for the indicator
The indicator doesn’t come with any settings. As for the timeframe, you should use the Accumulative Swing Index indicator on higher timeframes to reduce market signals.
How to trade with the Accumulative Swing Index Indicator?
Before you start trading with the indicator, it’s important to remember that ASI tells the long-term trend’s strength rather than the short-term. That’s why you should use it for swing or position trading.
The Swing Index indicator can help you determine the trend’s direction through the upward and downward momentum of the signal line.
When the ASI is positive, it mentions the long-term uptrend. Conversely, when the ASI is negative, it suggests the long-term trend will be negative.
If the ASI moves closer to the centerline, it suggests a flat trend, and you shouldn’t take positions during this period.
The Accumulative Swing Index also helps in determining breakouts. When the price breaks through the trendline, it suggests a market reversal.
To trade according to the trendline, you must draw a trendline on the ASI. Then you have to draw a trendline on the chart. If the price breaks through the trendline and the ASI signal line breaks through also, it’s a sign of a breakout.
In the chart below, you can see when the ASI trendline breaks; we had a potential breakout.
It’s important to remember that in some cases, the price may not break out or reverses when the ASI shows a trendline break. It happens mainly during high volatility.
Advantages of Swing Index Indicator
- The indicator is relatively easier to use.
- You can combine the ASI in trend-following and reversal strategies.
Accumulative Swing Index vs. Accumulation Distribution
The Accumulative Swing Index and Accumulation Distribution follow the price pattern, have a single signal line, and don’t come with any settings.
However, the difference lies in the calculations. The A/D uses the money flow multiplier and only applies the high, low, and close prices. Conversely, ASI uses a complex equation on high, open, low, and close prices.
In addition, A/D is a volume-based indicator that helps to find the asset’s supply (distribution) and demand (accumulation). Whereas the Accumulative Swing Index is a trendline indicator.
Summary
The Accumulative Swing Index indicator finds the trend direction by following the price pattern. It gives values between positive and negative for a long-term trend direction.
You can also use it to locate market reversals through trendline breakouts. However, as the indicator is prone to false breakouts, combining the ASI with other indicators is important for further signal confirmation.

