The Fractal Chaos indicator connects the highest and lowest points in the period to represent the market volatility. These highest and lowest points create upper and lower bands on the chart.
The upper band forms after connecting the highest points, while the lower band forms after the lowest points’ connection. The price movements within these bands highlight the market chaos.
Bill Williams, the renewed trader, developed the traditional Fractals indicator and mentioned it in his book Chaos Trading. This is exactly what Fractal Chaos captures, too; the market chaos.

How to read the Fractal Chaos indicator?
Reading the Fractal Chaos indicator isn’t difficult. The upper bands (red) form after connecting the highest bands, while the lower bands (green) form after connecting the lowest bands.
The price tends to move between these bands, and whenever it breaks through the bands, it gives a potential trading signal. The indicator’s bands mirror the price movement, but they smooth out market noise, taking only key price fluctuations into account.
Basically, Fractals Chaos applies the Chaos theory to represent price volatility. Chaos theory is a mathematical theory that has been used to explain several characteristics of systems that have historically been difficult to represent.
The Chaos theory explains how markets can experience unexpected volatility due to psychology in trading. And that’s what Bill Williams explains in his book, Chaos Trading.
The Fractal Chaos indicator uses the chaos theory to predict the traders’ sentiments like fear, greed, hope, doubt, and other emotions, which play a huge role in trading. The indicator also shows changes in volume and the momentum behind the changes.
The good thing about the Fractal Chaos indicator is that it works on all timeframes. Therefore, it is suitable for all types of strategies.
How to trade with the Fractal Chaos Indicator?
As mentioned earlier, the Fractal Chaos indicator’s bands mirror the movement of the price, so whenever the price breaks through the bands, it presents a trading signal.
When the price moves above the upper band, it represents the exhaustion of buyers, and the price will reverse soon. Here, you can take short positions or exit long ones.
Conversely, when the price moves below the lower band, it marks the exhaustion of sellers, and the price will reverse. Here, you can take buy positions or exit short ones.
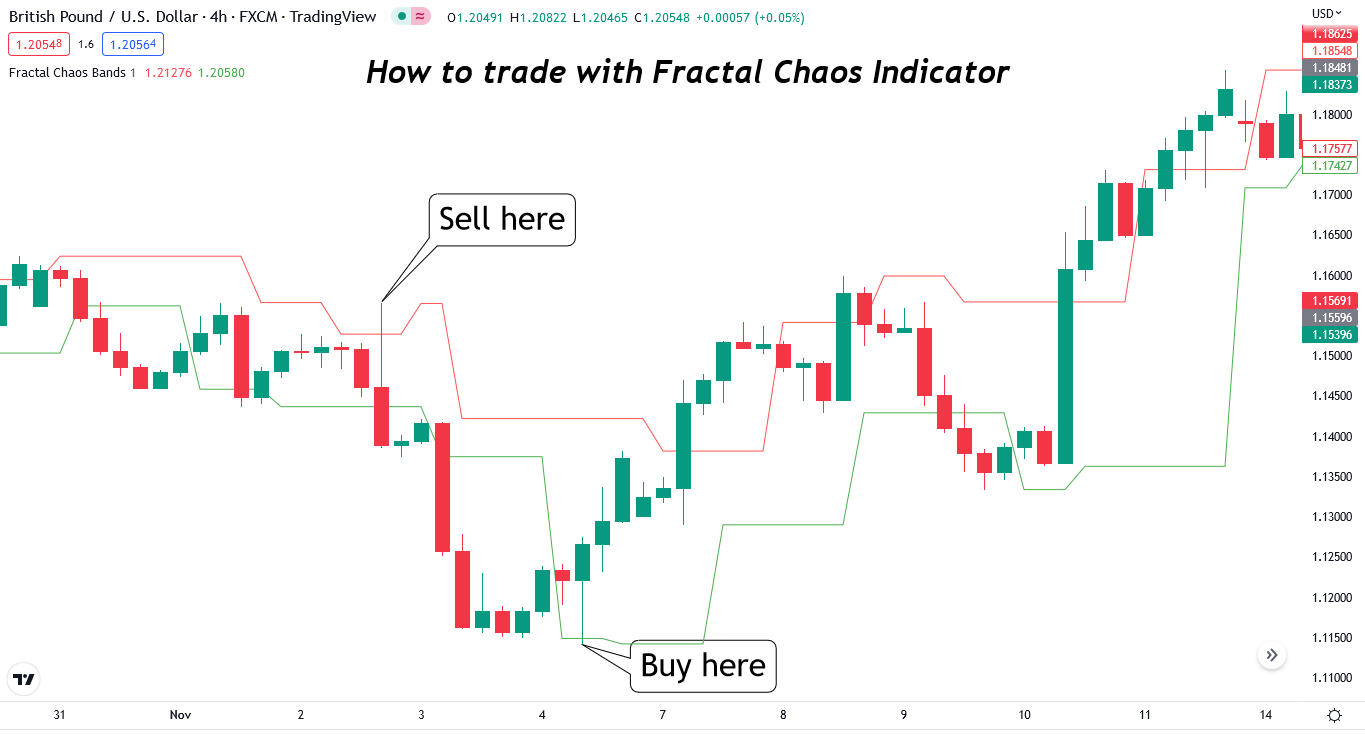
It’s important to remember to let the price break through the bands and then take positions, as sometimes the price touches the bands but continues in the same direction.
In a period of consolidation, the price will say between the bands. It signals a flat trend, and you should avoid taking positions.
Traders frequently apply SMA (simple moving average) with the Fractal Chaos to confirm the trend. You can use any SMA period.
When the price goes above the SMA and touches the lower band of the Fractal Chaos, it’s a buy signal. Conversely, it’s a sell signal when the price dips below the SMA after breaking through the upper band.
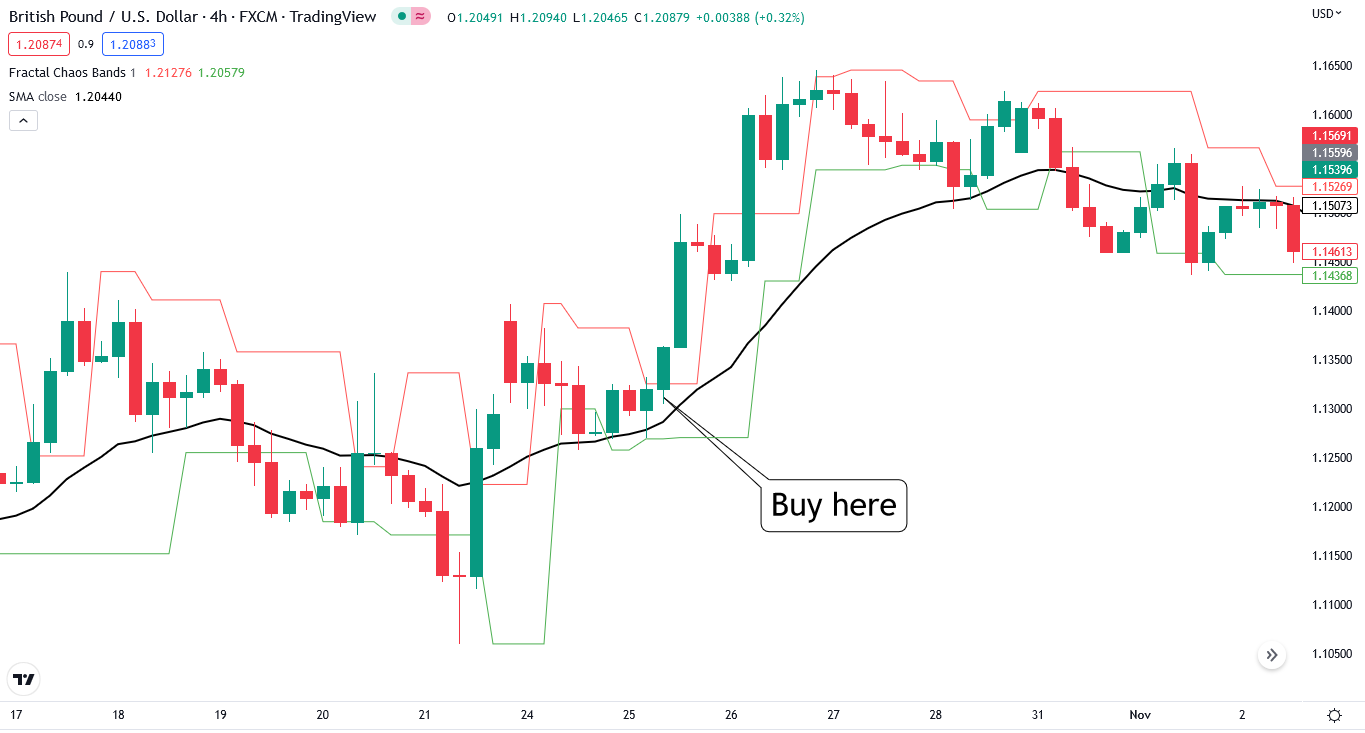
The chart above shows that after the price hit the lower band, it moved above the SMA, presenting a buy signal.
Advantages of Fractal Chaos Indicator
- The indicator is super easy to use.
- You can combine it into multiple strategies.
- It is based on market sentiment.
Limitations of Fractal Chaos Indicator
- You have to use Fractal Chaos with other indicators to confirm signals.
- It doesn’t necessarily suggest a change in trend.
Fractal Chaos indicator vs. Bollinger Bands
Fractal Chaos and Bollinger Bands plot bands on the chart represent market volatility. However, both indicators have different calculations.
Bollinger Bands is based on Standard Deviation, and the bands adjust to volatility swings according to periods and Standard Deviation. Fractal Chaos uses a mathematical model to plot bands.
Secondly, there are three lines in BB; upper band, lower band, and middle band, while Fractal Chaos has two bands.
Also, the price stays within the bands of BB while it breaks through bands of Fractal Chaos.

Summary
The Fractal Chaos indicator helps in determining the market volatility. The bands highlight traders’ sentiments and can help in predating the reversal.
You need to combine the Fractal Chaos with other indicators for further signal confirmation.