Moving Average (or MA for short) is one of the most versatile and popular indicators on the market that can be used to trade with the trend. A moving average shows the average price over a specified time period (it can be 15 days or 15 minutes) and is a lagging indicator. There are two main types of moving averages – simple moving average (SMA) and exponential moving average (EMA).
As the name suggests, a simple moving average is simply the average price of a trading instrument over a certain period of time. On the other hand, an exponential moving average gives more weight to more recent price readings. I prefer to use an exponential moving average, which best reflects recent price action and follows it more closely.
Simple and exponential moving averages look like a smooth line. For example, a 50-period moving average on a daily chart uses the last 50 days of price movement to form an average.A moving average should never be used in isolation. It is best combined with price action patterns and other market signals.
TYPES AND PARAMETERS OF MOVING AVERAGES
There are four most popular moving averages:
- The simple moving average is the SMA or simply the MA.
- Exponential moving average – EMA.
- Smoothed moving average – SMMA.
- Linear weighted moving average – LWMA.
It should be noted that the exponential moving average and the linear weighted moving average give more weight to recent values. Because of this, these types of MA react faster to the latest price changes.
MOVING AVERAGE TYPES
When using the moving average indicator in Metatrader, you can choose from several options:
The period is the time unit to calculate. For example, a period of 10 on a daily chart means 10 days.
A shift is a time delay to apply to an indicator.
For example, period 5 on an hourly chart means the moving average shifts to the right by 5 hours.
The MA method is the calculation method applied to the MA or type of MA that you want to see on your chart.
Apply to is the price to which you want to apply the moving average calculation formula. For example, calculate the moving average for the closing price.
moving average – settings
MEAN REVERSION AND MOVING AVERAGE
Mean reversion is a theory that is often used in financial markets.
It represents the tendency of the market to constantly return to its average price. We can use this pattern to find the optimal entry point.
In the illustration above, we have two elements: the average value of the price and the return to this value.
While this concept is easy to understand, it can change the way you look at the market. This is where the moving average comes in handy.
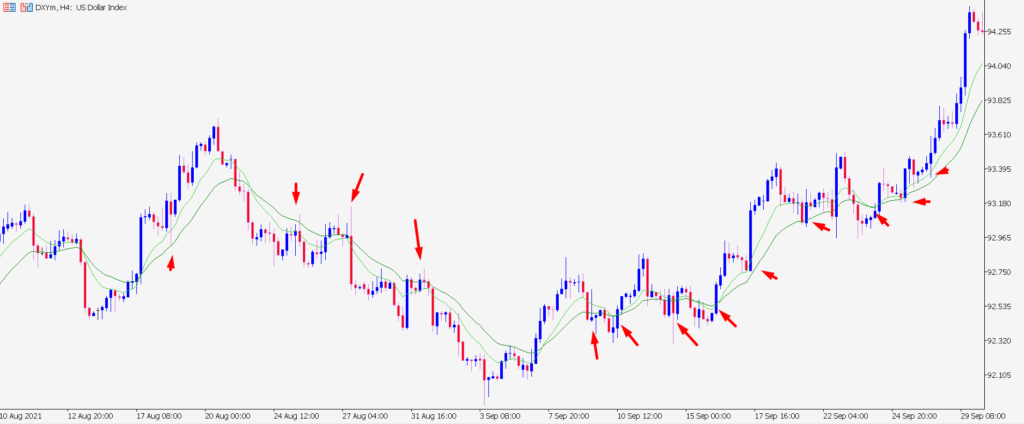
We can use 10 and 20 EMAs:
The area between the 10 and 20 EMA acts as a zone that indicates a price reversion to the mean.
This zone represents the average market price.
Notice how the market finds support and resistance in this area within the trend.
This is where the 10 and 20 exponential moving averages help us find market entry points.
OVERBOUGHT AND OVERSOLD
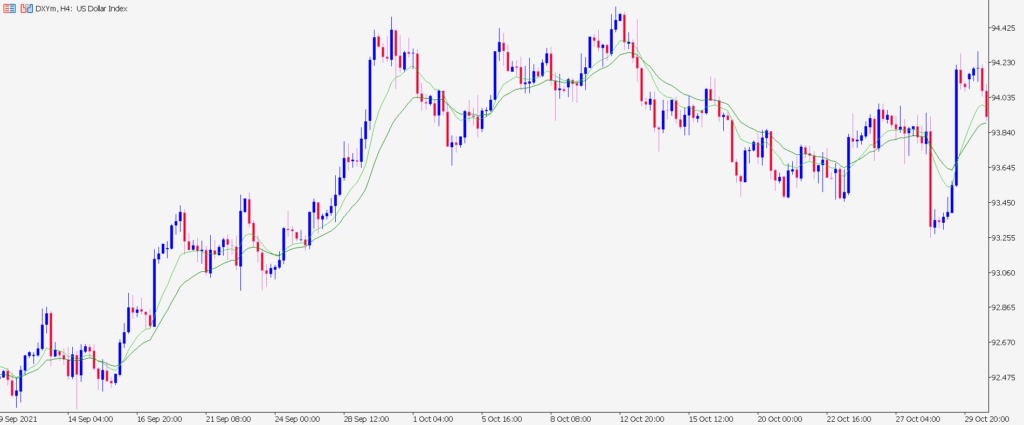
One of the most common traps among traders is entering the market on impulse price movements, in other words, buying or selling at overbought or oversold levels.
Such entries should be avoided.
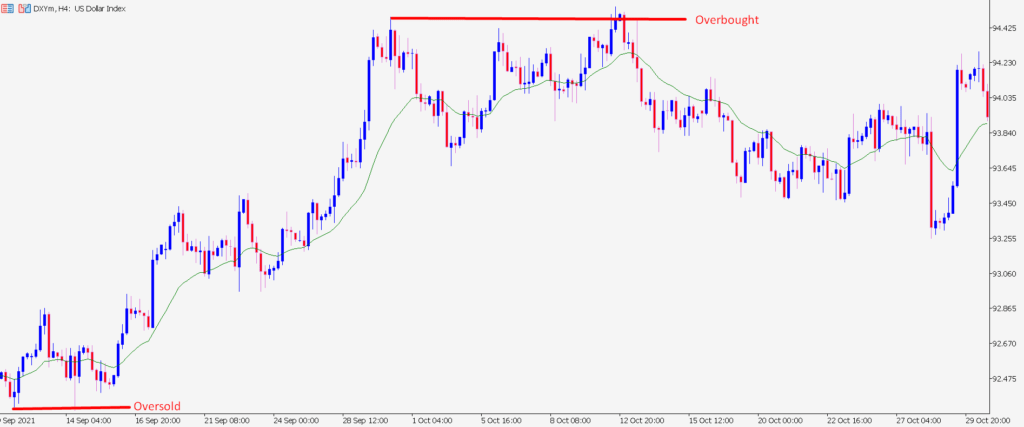
In the chart above, I highlighted the overbought and oversold areas from which the price returns to its average value.
If the price deviates too far from the moving averages, it is always best to wait for it to pull back to the mean before entering buys or sells.
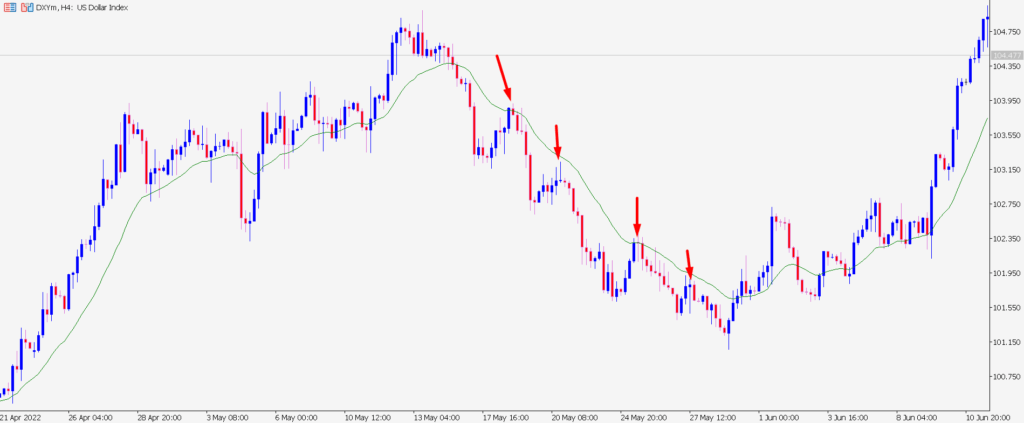
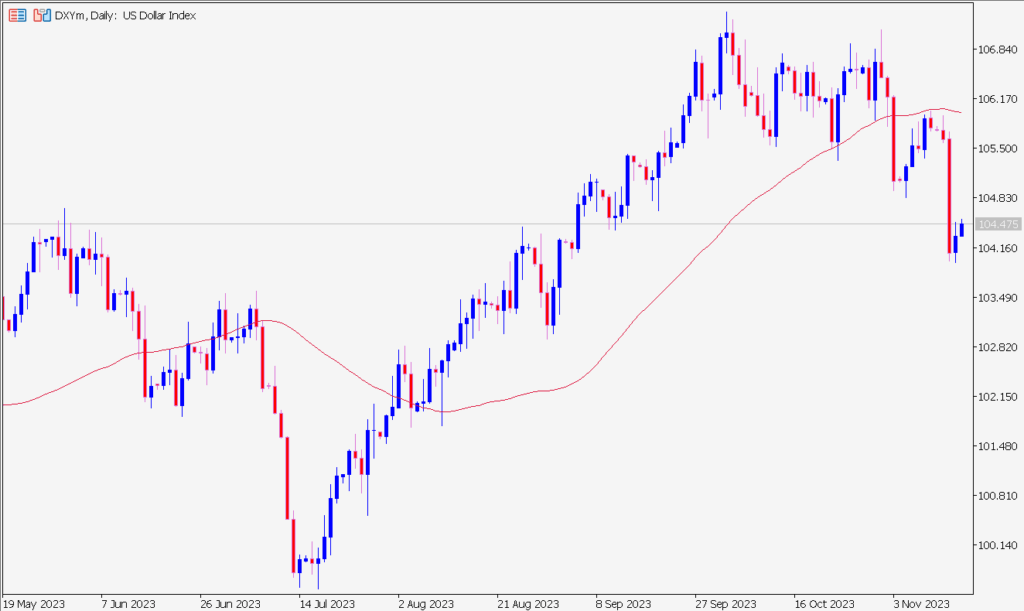
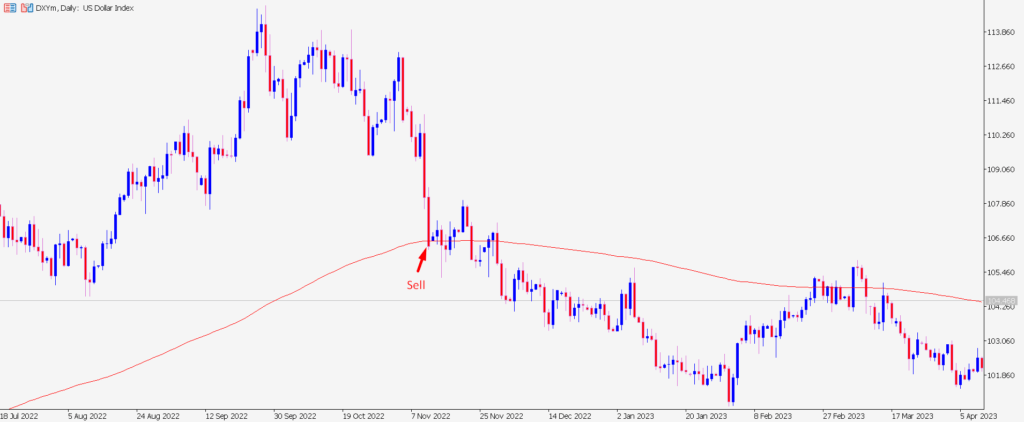
On the daily chart, the price made two extended moves down from the 10 and 20 EMAs.
In these areas, it is best not to enter the market. Instead, we expect the price to return to the moving averages, and only from them we are already looking for a sell entry point.
How do we understand that the price is in the overbought or oversold area? It depends on several factors:
- Trading tool.
- Timeframe.
- Current market conditions.
Trading instruments can be currencies, stocks, commodities.
Each instrument moves to its own music. That is, it has its own characteristics and the nature of the price movement.
On each timeframe, the price can behave differently.
I have found that the 10 and 20 exponential moving averages work best on the 4 hour and daily charts . In my experience, these two timeframes are the most reliable for identifying trading opportunities.
Current market conditions allow us to understand how the market might react to the average.
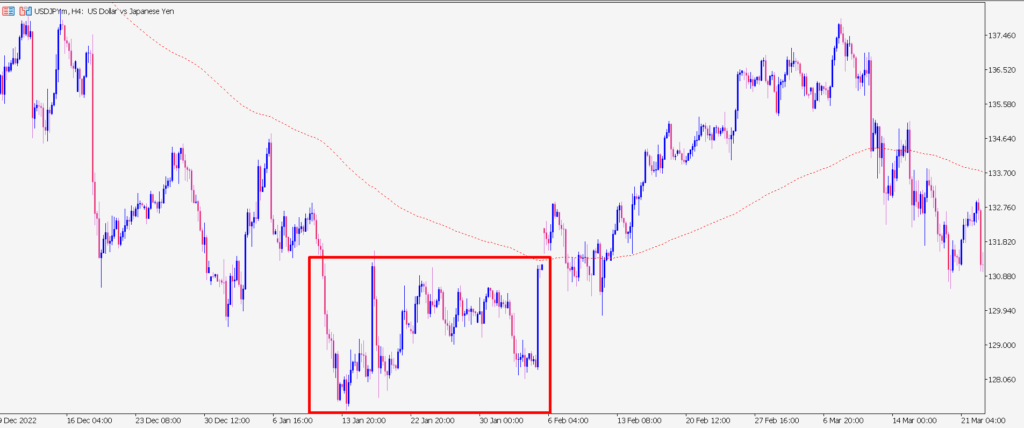
It should be noted that the study and application of the average value is only suitable for a trending market .
So if the market is trading in a range or is too volatile, mean reversion is best not to use.
We should avoid buying or selling when the market has moved too far from the moving averages. An exception to the rule can be a fast market.
What does this mean?
This is a market where extreme buying or selling occurs and is therefore unlikely to return to its average price anytime soon.
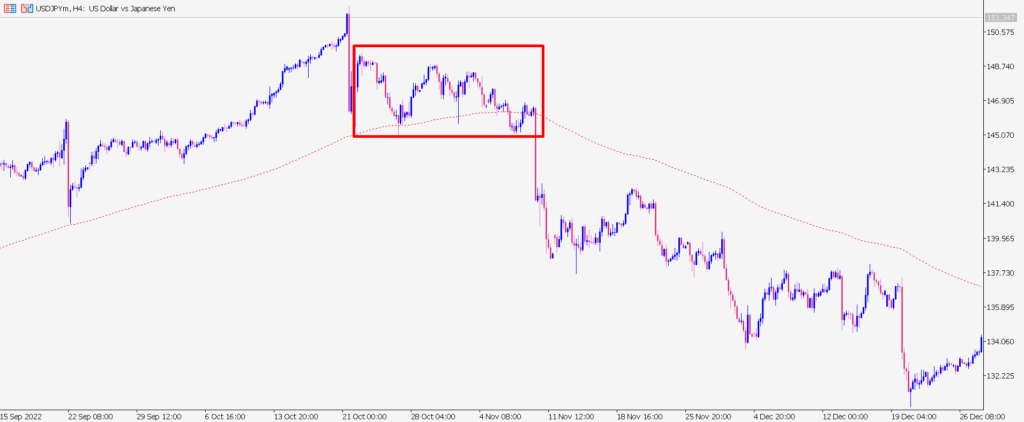
the price does not return to the moving average for a long period of time
The market made two sharp moves during which there was no reversion to the mean.
In fact, the second rally was 1600 points.
The price rarely covers such a distance without pullbacks, but sometimes it happens.
MOVING AVERAGE AND TREND TRADING
The moving average signals a possible trend change and also helps to determine the strength of the current trend.
However, there are trends in which the moving average will be absolutely unnecessary.
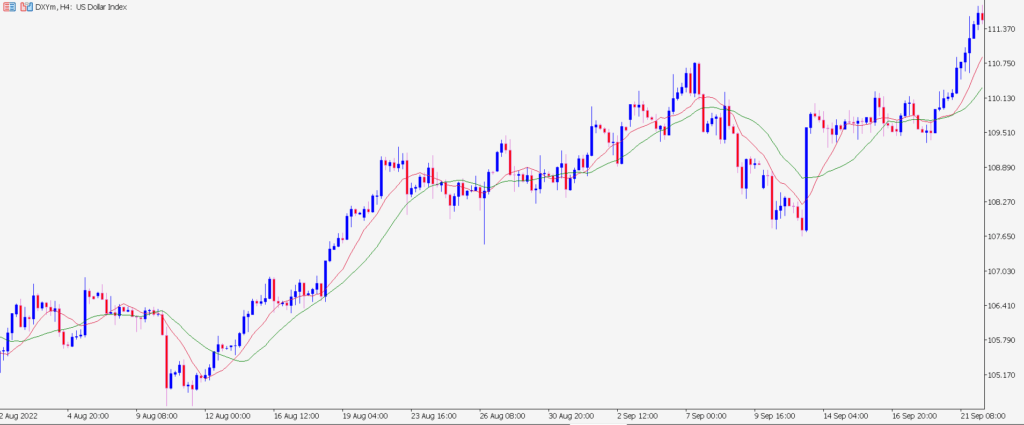
e.g., strong trend and moving average
The market is in a strong downtrend and this is obvious without any indicators.
Now let’s take a look at a chart where moving averages can help determine the strength of a trend as well as its potential reversal:
As we know, a downtrend consists of a series of lower highs and lower lows. But sometimes the market makes a higher high in a downtrend. Does this mean the trend is over?
End of downtrend?
A higher high in a downtrend will not always mean the trend is over.
This can be a difficult pullback before the trend resumes its movement on a given trajectory.
You are probably thinking, “How can I identify a trend more objectively?”
You can use a moving average to help you with this.
For example, if the price is above the 200 EMA, it means that the market is in a long-term uptrend.
If the price is above the 20 EMA, then the market is in a short-term uptrend.
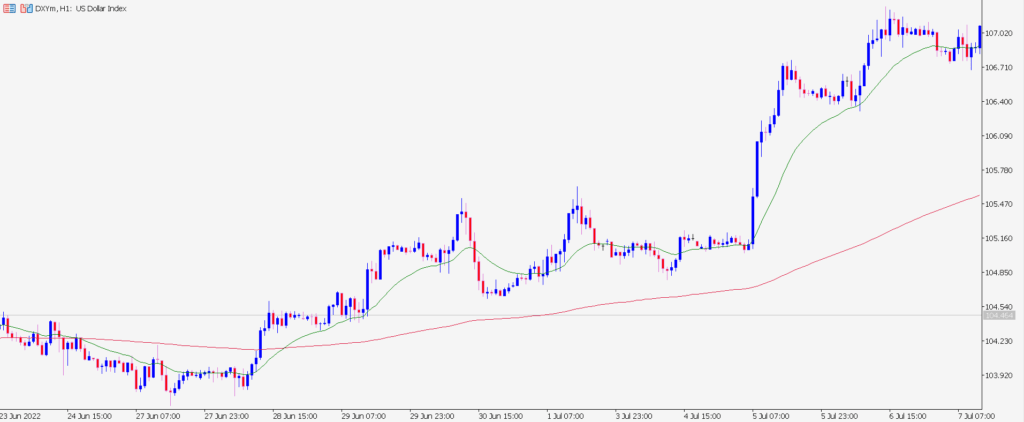
You can gauge the strength of a trend by looking at the steepness of the moving averages.
The steeper they are, the stronger the trend.
If the moving average becomes horizontal, then there is no trend at all.
steep moving averages indicate the strength of the trend
There are many variations of moving averages a trader can use, but my favorites are the 10 EMA and 20 EMA.
When used correctly, these two moving averages can make trend trading much easier.
We only look for buying opportunities when the 10 EMA is above the 20 EMA.
Because the 10 EMA follows price action more closely than the 20 EMA, it signals that the market is in an uptrend.
On the other hand, when the 10 EMA is below the 20 EMA, we look for selling opportunities as the market is in a downtrend.
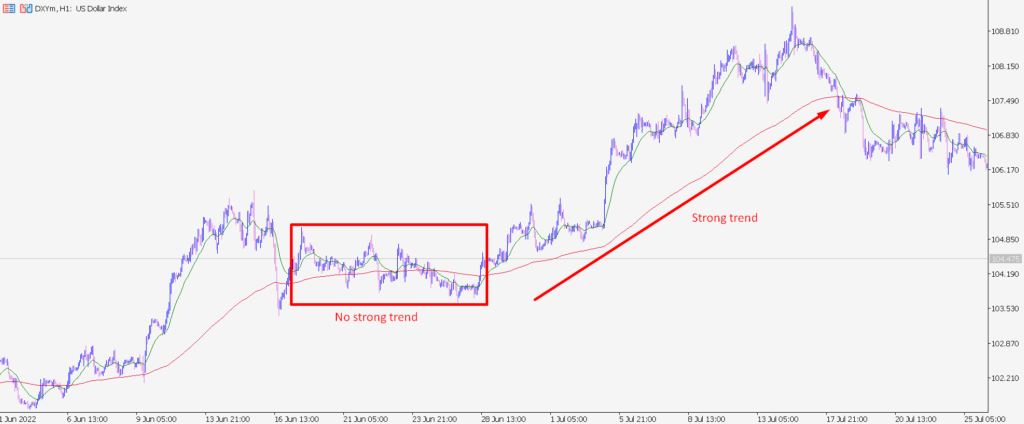
If you want to earn more, you need to find a strong trending market.
This will allow you to get more potential for profit.
To do this, you use the 20 and 50 SMA and compare their slope. The stronger it is, the more volatile the market will be.
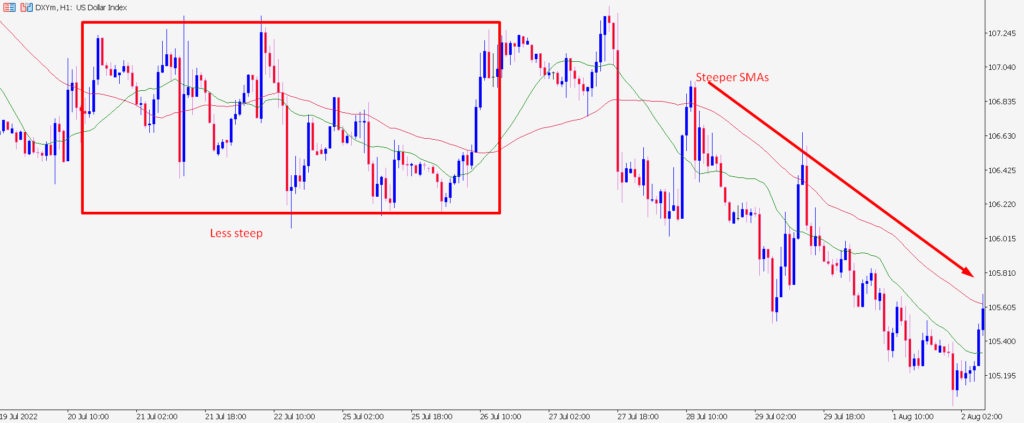
It is clear that on the first chart, the profit potential will be much greater than on the second, and therefore the first chart is preferable for trading.
Keep in mind that moving averages are a trending indicator, so they should only be used in trending markets and should be forgotten about during periods of consolidation.
DYNAMIC SUPPORT AND RESISTANCE LEVELS
In a trending market, moving averages can act as dynamic support and resistance levels.
The market can be compared to a rubber band.
If it stretches too far, it always rolls back.
That is, the market constantly returns to the moving average.
Therefore, if you want to find a good entry point in a trending market, always wait for the price to return to the moving average.
Before moving on, I want to say that dynamic support and resistance levels are not as strong or indicative as horizontal levels.
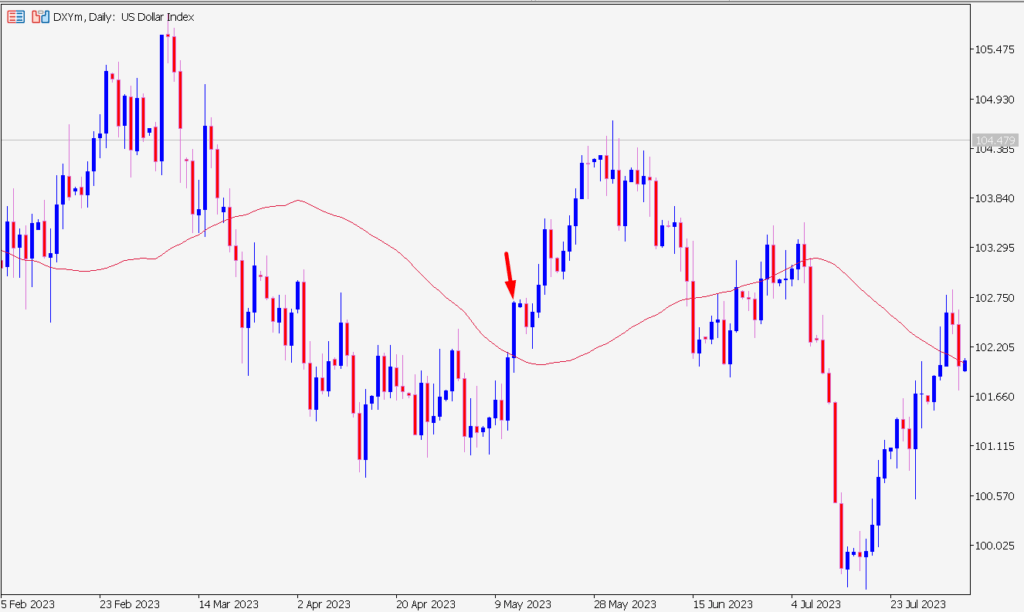
Dynamic support and resistance can be found where the moving average intersects with the current price.
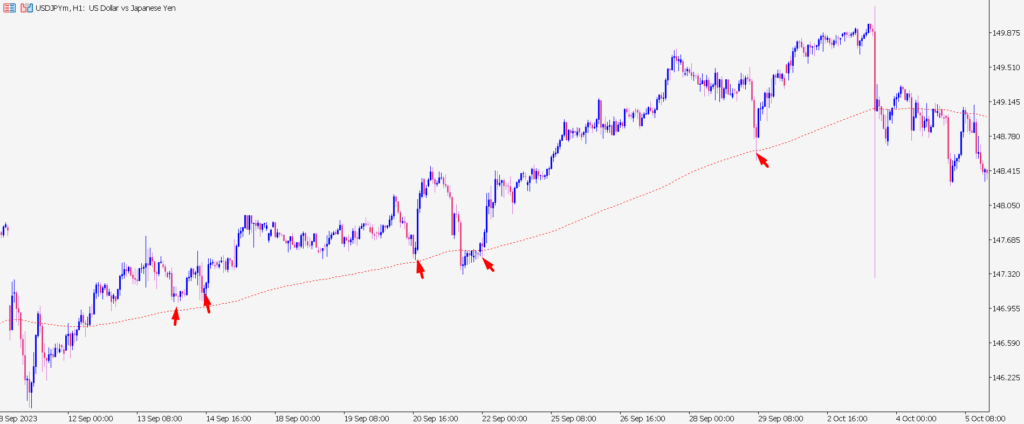
Notice how the 10 and 20 period exponential moving averages work as support and resistance for price.
Let’s take a look at the 10 and 20 EMAs that act as dynamic resistance during a downtrend:
Note that as soon as the 10 EMA crossed over the 20 EMA, the moving average began to act as dynamic resistance.
For trading, dynamic levels can only be used in combination with other structural factors and price action patterns:
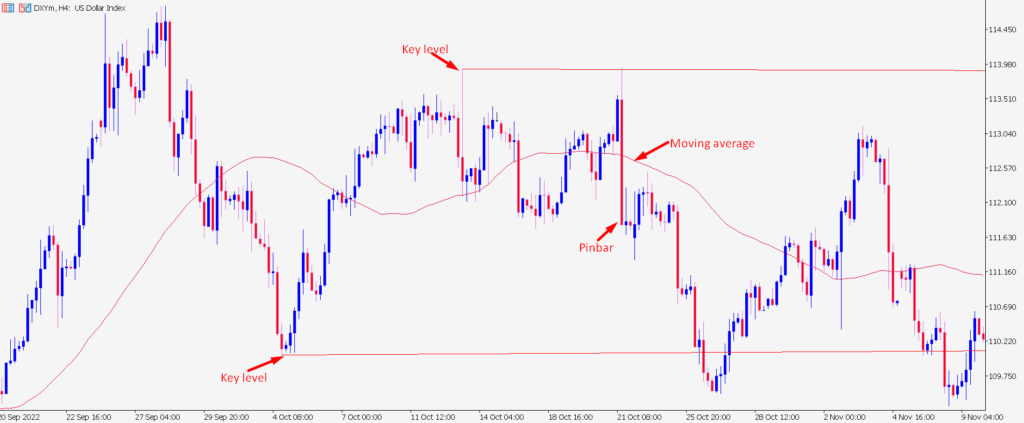
Here we see a pin bar at a horizontal level and the price bouncing off the dynamic level. All of this is happening in an uptrend. It turns out the perfect trading setup.
Here is a list of the five most common moving averages that traders can use:
- 10
- 20
- 50
- 100
- 200
Since the above periods are used more often than others, the market tends to respect them more than others.
This is the same reason that support and resistance levels work in the market : if enough traders use the same level to buy or sell, it is likely that the market will react to it.
We can use dynamic support and resistance levels to place a stop loss .
When the market is trending, the price tends to bounce off dynamic levels.
They represent a kind of barrier that prevents the price from moving.
Thus, placing a stop loss behind the dynamic level formed by the moving average makes logical sense.
How can you earn more in trending markets?
The only way to take all the trend action is to have no profit-taking targets. If you are taking profit, then you are limiting the potential of your trade.
Therefore, in strong trending markets, it is better not to set a take profit, but only use a stop loss, placing it behind a dynamic support and resistance line.
This can be done in trending markets over a long period of time.
- 50 EMA moving average
- moving average and trailing stop
The period of your moving average will determine the strength of the trend you want to profit from. Short-term MAs (like the 5 EMA) will allow you to ride short-term trends.
While a long-term MA (for example, 200 EMA) will allow you to take maximum profit from long-term trends.
MOVING AVERAGE: TRADING STRATEGY
We will use the moving average to determine the best entry points on the charts.
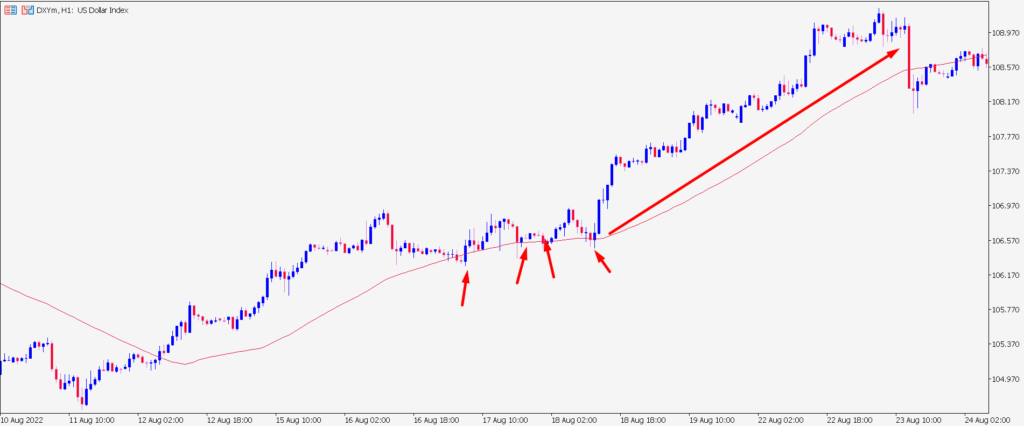
- If the price is above the 200 EMA, then the market is in an uptrend.
- Wait for two tests of dynamic support formed by the intersection of the 20 and 50 EMAs.
- Enter the trade on the third or subsequent test.
- Place a stop loss of 2 ATR from your entry point.
- Exit the trade when the price closes above the 50 EMA.
- moving average trading strategy
50 DAY MOVING AVERAGE TRADING STRATEGY
As we already know, there is no best moving average. However, in a general trend, the 50-day moving average is one of the best indicators.
How to use the 50 day moving average to find trading opportunities?
Most traders are familiar with the strategy of entering the market at support and resistance levels .
This strategy works well when the market is in a range or a weak trend.
But what if the market is in a similar trend?
healthy trend and moving average
As you can see, the market does not test the support level for a long time, and you can stay out of the market for a long time looking for the right trading opportunity.
What to do?
This is where the 50 day moving average comes into play.
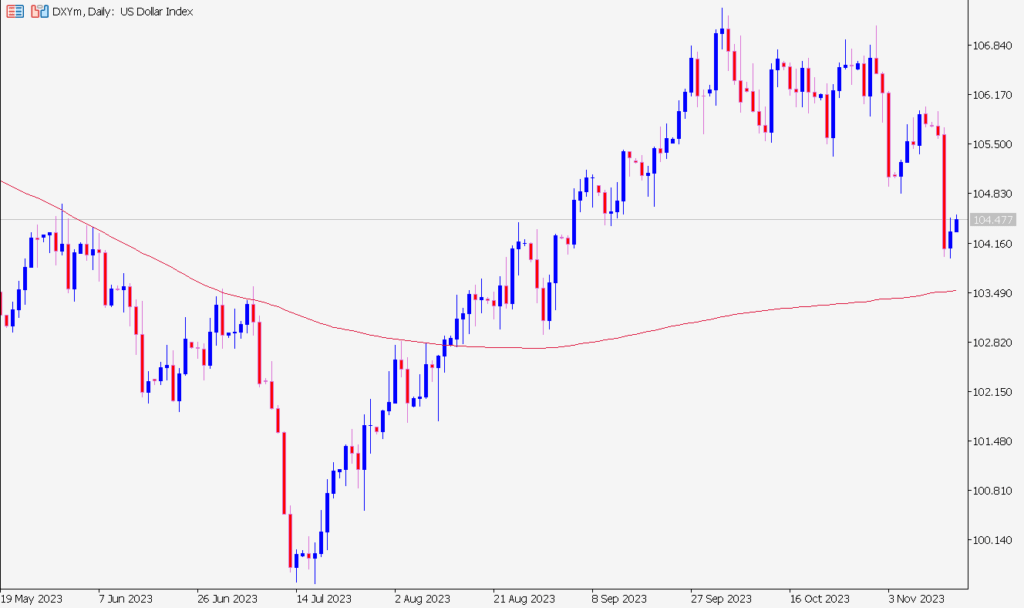
Let’s look at the same chart again, this time with a 50-day moving average over it:
significant area in trend
See the difference?
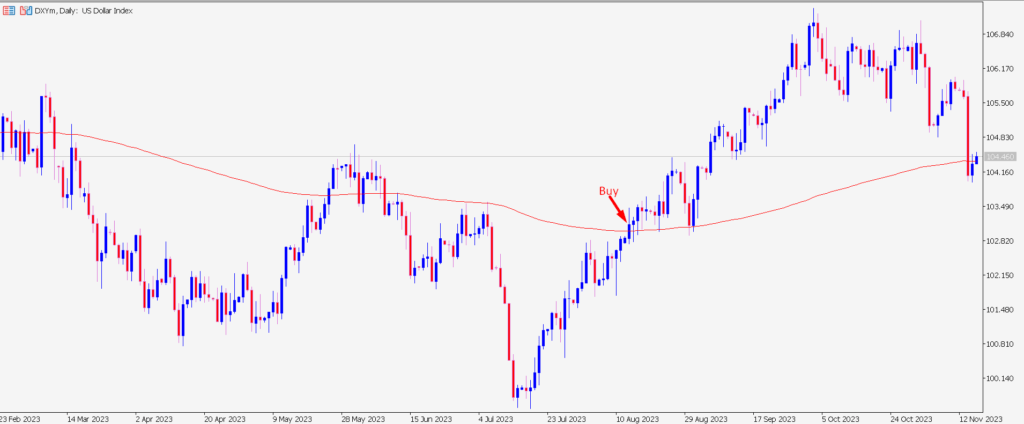
After price retests the 50 day moving average, you can use price action patterns to find a market entry point.
How to hatch long-term trends with the 50 MA?
When it comes to trend trading, many traders take profits at the slightest pullback. At the same time, they tighten their trailing stop too much !
It’s like chasing a girl. If you get too close to her, she will run away. But if you give her freedom, you will have a better chance of winning her over.
Therefore, you must learn to let the price breathe. One approach for this is to use the 50-day moving average to move your stop loss.
This means that you must hold your position as long as the price stays above the 50 day moving average. And exit the market only when it closes below it (and vice versa for a short position).
50 day moving average and trailing stop
How to use the 50 day moving average for reversal trading?
When you are trading a trend reversal, the timing of your entry is critical. If you enter the market too early, you risk being stopped out. If you are late, you are missing out on a big price move.
How can you accurately find the time to enter the market, neither too early nor too late?
You can use the 50 day moving average which can act as a trend filter.
If you want to go short against an uptrend, wait until the price closes below the 50-day moving average (and vice versa if you are long).
But what if the price doesn’t close below the 50-day moving average, can I go short?
No!
You must stay out of the market. Let the 50-day moving average act as a trend filter and tell you when it’s safest to go short.
To increase the profitability of your trades, make sure the price is based on the higher time frame market structure. For example, if you are looking to go short, check that the price is at the resistance level on the higher time frame.
How to enter the market on time?
Do you open your trades too late, only then realizing that you bought at the highs? At the same time, your stop loss is knocked out on the first pullback? The market continues its growth, but already without you? Why is this happening? The reason is that you can enter the market too far from the significant area. Therefore, learn to look for entry points near a significant area.
For example, in a healthy trend, a significant area is near the 50-day moving average.
meaningful area in an uptrend
And here you should not open deals:
the price is too far from the moving average
In a strong trend, a significant area is near the 20-day moving average.
50 day moving average and finding the best entry points
There are two techniques you can use:
1.Reversal patterns price action .
2.Breakout of the trend line .
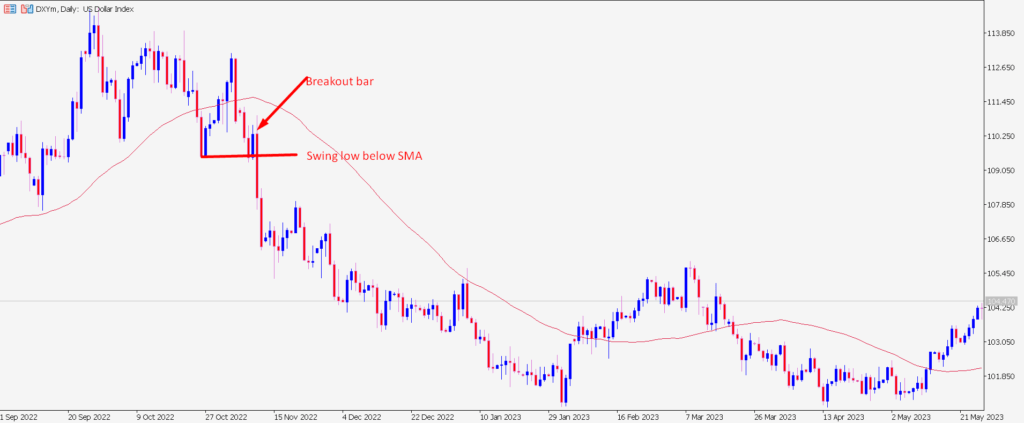
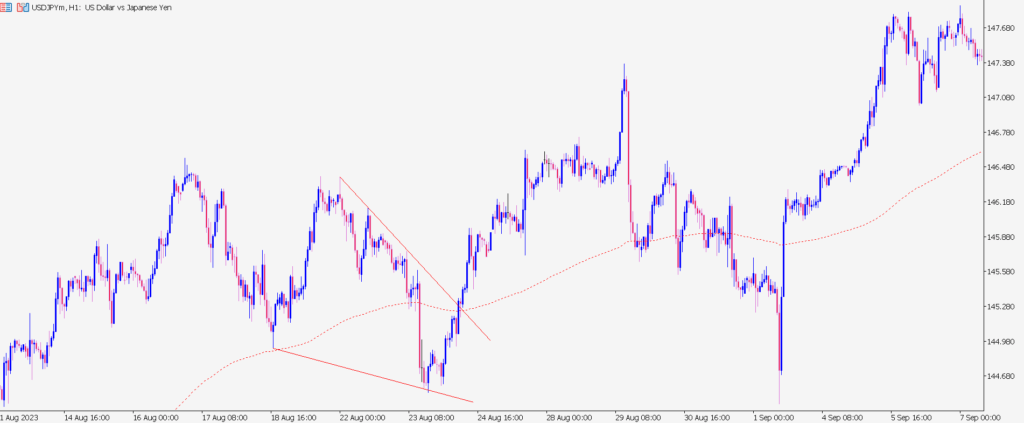
We know that the moving average acts as a meaningful area in a healthy trend. What to do when the price retests the 50-day moving average? Here we can look for price action reversal patterns such as pin bar, engulfing patterns .
When the price pulls back to the 50-day moving average, you can draw a mini trend line to help you find your entry point.
trendline breakout
Trading strategy for 50 MA
The idea of this trading strategy is to profit from one big wave in a healthy trend. Here’s how it works:
- Find a healthy trend where the price is in line with the 50 day moving average.
- Wait for the price to retest the 50 day moving average.
- Look for an entry trigger (for example, a price action pattern on a breakout of a trend line).
- Enter the market only at the open of the next candle.
- Set your stop loss below 1 ATR of the previous low.
- If the price moves in your favor, exit at the next reversal.
Here are some examples:
- moving average and pin bar
- moving average and engulfing pattern
- moving average – entry on a rollback
200 DAY MOVING AVERAGE TRADING STRATEGY
The 200 day moving average (200 MA) is one of the most popular technical indicators. In news reports and analytical reviews, you will often find:
The S&P 500 has fallen below the 200 day moving average – the market is bearish.
Enter into buys when the price exceeds the 200 day moving average.
Apple stock just closed below the 200 MA – time to sell.
However, more often than not, these tips will be completely useless, as they will push you to open positions on emotions and enter the market at the most inopportune time. In today’s article, we will analyze all the nuances and features of trading on the 200-day moving average.
What is a 200 day moving average?
A moving average is a technical indicator that averages recent price readings and is displayed as a line on a chart.
Let’s assume that over the past 5 days, Apple’s stock price has been 100, 90, 95, 105, and 100. So the 5-day moving average is:
100 + 90 + 95+ 105 + 100 / 5 = 98
All 5-period MA values can be displayed as a smooth line on the chart. The same is true for the 200 day moving average. The only difference is that you are looking at the last 200 days of data, which shows a longer-term moving average.
There are also different types of moving averages: simple, exponential, weighted. The concept in each of them is the same, however, they differ slightly in the methods of calculation.
How can I use the 200 day moving average?
The 200 day moving average is a long-term indicator that you can use to identify and trade in a long-term trend.
- If the price is above the 200-day moving average, we consider buying.
- If the price is within the 200-day moving average, we look for opportunities to sell.
If you are trading stocks, you can look at the index to see the big picture of the direction of the market. For example, if the price is above the 200-day moving average in the S&P 500 index, look for opportunities to buy US stocks. This simple technique will increase your chances of making a profit and also reduce your potential drawdown.
What is the best way to enter the market?
Now you are probably thinking, “Now it is clear how to determine the prevailing trend in the market. But how can you find a suitable entry point?”
Here are a few methods you can use:
- Support and resistance levels .
- Rebound from 200 MA.
- Triangle figure .
- Flag figure .
Let’s take a closer look at each of these methods.
Support and resistance levels
Support is an area on the chart with potential buying pressure. Resistance is an area on a chart with potential selling pressure.
Thus, if the price is above the 200 day moving average, we are looking for buying opportunities at the support level. If the price is lower, look for opportunities to sell at the resistance level.
Rebound from 200 MA
During a trend, the 200-day moving average can act as a significant area from which the price constantly bounces. This gives us the opportunity to enter the market.
The setup gains more strength when the 200 MA line crosses the nearest support or resistance levels.
Triangle
An ascending triangle is a sign of strength that tells us that buyers are willing to buy at higher prices. Thus, in an uptrend, when the price is above the 200MA, you can find an ascending triangle and open a position on its breakout. Accordingly, in a downtrend, we are looking for a descending triangle.
The longer the triangle is formed, the stronger its breakdown will be.
Flag
The flag figure is another trend continuation pattern.
A bullish flag indicates that buyers are in control of the market and sellers are having trouble going short (hence why we see a pullback with a small candle size). Thus, in an uptrend, you can find a bullish flag and open a position on its breakout. In a downtrend, we are looking for a bearish flag.
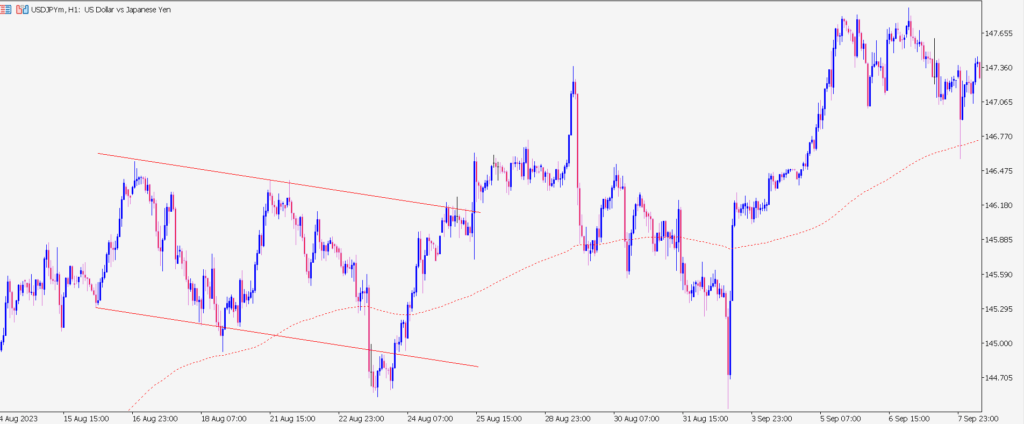
The best flag patterns appear after the breakout of a long-term consolidation.
How to hold a position in a trend with a 200-day moving average?
If you want to take maximum profit in long-term trends, you can use a trailing stop, while leaving a sufficient buffer for the price to move. We can carry the stop loss with the 200 day moving average.
The position is closed only when the price crosses the 200 MA.
Determining Market Phases with the 200 MA
The market is constantly moving from trend to consolidation and vice versa. It is possible to define 4 phases of the market :
- Accumulation.
- Trend.
- Distribution.
- The opposite trend.
The accumulation phase occurs after a downtrend and looks like a consolidation. The 200 MA is leveling off and the price is moving along it. Buyers and sellers are in balance, and the market has not yet decided on its direction.
In this phase, the price may break the level in any direction. If there is a breakdown of the support level, the downtrend continues. If there is a breakdown of the resistance level, an uptrend will occur.
A trend occurs when the price exits the accumulation phase. Price moves in a certain direction with higher highs and higher lows. At this point, you will see that the price will be above the 200 MA.
In the trending stage, the path of least resistance is up, so it is preferable to open long positions.
Eventually enough sellers will enter the market and the uptrend will end. There will be a distribution phase. The price will be within the boundaries of consolidation, and the 200 day moving average will level off.
At the distribution stage, the price can continue its movement in any direction. If there is a breakdown of the resistance level, the uptrend will continue. If there is a breakdown of the support level, a downtrend will begin.
When the price exits the distribution phase, a downtrend will occur. The market will be below the 200 day moving average. In a downtrend stage, the path of least resistance is downward, so it is preferable to open short positions.
A downtrend cannot go on forever. Sooner or later, the moment will come when it will attract a sufficient number of buyers. Then the market will return to the first stage – the accumulation phase.
Remember that the 4 phases of the market are more of an art than an exact science. Sometimes, it is not entirely clear what phase the market is currently in. If you have uncertainty, consider another trading tool that will be more understandable.