
The Swing Index indicator determines the real price of the asset by comparing the current and the previous prices high, low, open, and close.
Developed by Welles Wilder, the Swing Index is used as a part of the Accumulative Swing Index, with the indicator mentioning the swing index of each bar. It suggests a value between 0 and 100 for an up bar and 0 and -100 for a down bar.
A crossover above or below zero identifies a trend, and the Swing Index is used as a short-term trend detector rather than for long-term trends.

What is the Swing Index Indicator formula?
The formula for the Swing Index indicator is
SI = 50 × ((Cy−Ct) + (0.5 x (Cy−Oy) + (0.25 x (Ct−Ot) R) x K/T
Where;
Oy = Yesterday’s Open
Ot = Today’s Open
Hy = Yesterday’s High
Ht = Today’s High
Ly = Yesterday’s Low
Lt = Today’s Low
Cy = Yesterday’s Close
Ct = Today’s Close
K = largest of Ht – Cy and Lt – Cy
R = largest of Ht – Cy, Lt – Cy, and Ht – Lt
T = Limit Move Value
How to calculate the Swing Index Indicator?
To calculate the Swing Index indicator, you need to follow certain steps.
First, you need to find today’s open, high, low, and close.
Then you need to calculate yesterday’s open, close, high, and low.
After finding the values, you have to find the difference between the largest of today’s high/close and yesterday’s close to find the value of K.
Then, you have to find the difference between the largest of today’s high and yesterday’s close, today’s low and yesterday’s close, and today’s high and today’s low.
The limit move value is 30,000 by default.
Best settings for the indicator
The indicator doesn’t come with any settings. As for the timeframe, you should use the Swing Index indicator on higher timeframes to reduce market signals.

How to trade with the Swing Index Indicator?
The Swing Index indicator can help you determine the trend’s direction through crossovers.
When the Swing Index crosses above zero, it signals an uptrend. Here, you can take buy positions. Conversely, when the SI crosses below zero, it’s a sign of a downtrend, and you can take sell positions.

The second way to trade with the Swing Index is by finding divergences. The price makes higher highs in the bearish divergences, but the indicator makes lower highs. It means a weakening of bullish momentum, and there is a possibility of a trend reversal.
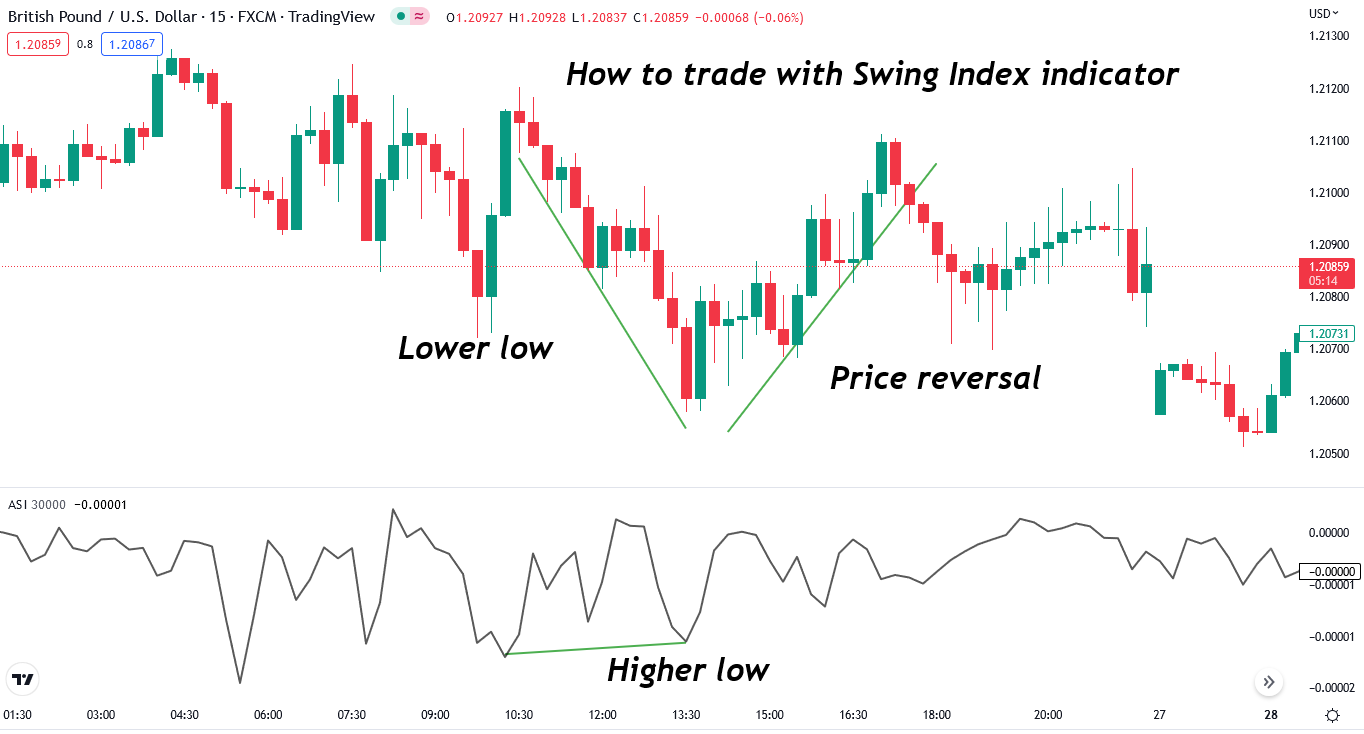
Conversely, the price makes lower lows in bullish divergences, and the Swing Index makes higher lows. It mentions a weakening bearish momentum and a chance of trend reversal.
The chart below shows that when the price made a lower low, and the Swing Index made a higher low, the price reversed.
The Swing Index can also help in determining short-term breakouts. An upward breakout occurs when the SI exceeds its value from the previous highest point. On the other hand, a downward breakout appears when the SI falls below the previous lowest point.
If you want to confirm the breakouts, you can do that by comparing the trendlines on the SI to the trendlines on the chart. As you can see on the chart below, we have similar trendlines on the chart and the Swing Index.
When the trendline on the chart doesn’t match the trendline on the Swing Index, we have a false breakout.
Advantages of Swing Index Indicator
- The indicator is super easy to use.
- You can combine it into multiple strategies.
Swing Index vs. Accumulation Distribution
The Swing Index and Accumulation Distribution look identical. Both are oscillators, have a single signal line, and don’t come with any settings.
However, A/D is volume-based that helps to find the asset’s supply (distribution) and demand (accumulation).
The Swing Index tells an asset’s real price by comparing the current and the previous prices.

Summary
The Swing Index indicator determines the real price of the bar by calculating the difference between the current and the previous prices. The indicator can help in locating the market trend and the breakouts.
You need to combine the Swing Index with other indicators for further signal confirmation.
Also, Swing Index is available as an Accumulative Swing Index on many platforms.