Key Takeaways
What is scalping?
Scalping is a trading strategy that involves buying and selling financial instruments, such as stocks, currencies, or futures contracts, to make small profits on each trade.
Scalpers try to profit by taking advantage of small price movements in highly liquid markets.
They typically hold their positions for a very short period, sometimes just a few seconds or minutes, and aim to make many trades in a single day.
Scalping can be a risky strategy, as it requires traders to make rapid decisions based on limited information and can expose them to large losses if the market moves against them.
It is also subject to higher transaction costs due to the high frequency of trades.
Scalping is generally unsuitable for long-term investors and is more commonly used by professional traders or algorithmic trading systems.
Why do you need indicators for Forex scalping?
Indicators can be useful for scalping as they provide real-time information about market conditions and help traders make more informed decisions about when to enter and exit trades.
However, it is important to note that indicators are based on past price data and should not be used as the sole basis for trading decisions.
Forex indicators can help traders make more informed decisions by visually representing market trends and patterns.
For example, a moving average indicator shows the average price of a currency pair over a certain period of time, which can help traders identify the overall trend and potential entry and exit points.
Other indicators, such as the relative strength index (RSI) and the stochastic oscillator, can help traders identify overbought and oversold conditions and potential trend reversals.
Indicators can be used alone or with other indicators or price action analysis to help traders make more informed trading decisions.
However, it is important to note that indicators should not be relied upon solely, as they are based on past data and do not consider all the factors that can affect market movements.
Top 10 Forex scalping indicators
Let’s take a look at our top 5 indicators. Read more to find out why we chose them.
1. Moving Averages
Moving averages (MAs) are a common technical indicator used in forex trading, including scalping strategies.
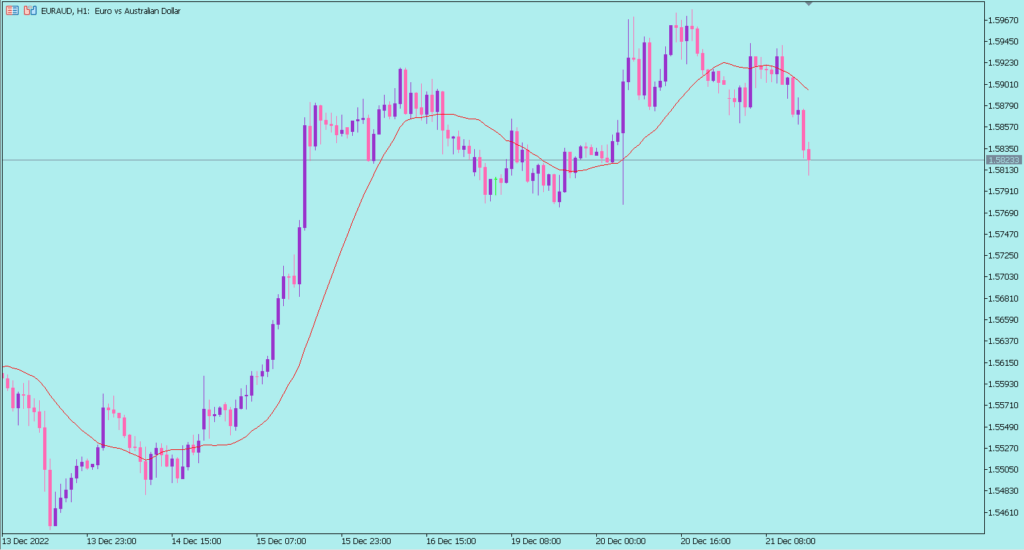
MAs are based on the average price of a currency pair over a certain period of time and are used to smooth out short-term price fluctuations, making it easier to identify the overall trend.
There are several types of moving averages, including simple moving averages (SMAs), exponential moving averages (EMAs), and weighted moving averages (WMAs).
The choice of moving average type depends on the trading strategy and the timeframe being traded.
Scalpers, who seek to profit from small price movements over very short periods, may use MAs to help identify short-term trends and potential entry and exit points.
For example, a scalper may use a 5-period SMA on a 1-minute chart to identify the overall trend and potential points to enter and exit trades.
Pros
- MAs are simple and easy to use, making them a popular choice among traders of all experience levels.
- MAs can help smooth out short-term price fluctuations, making it easier to identify the overall trend.
- MAs can be used to identify potential entry and exit points and confirm a trend’s strength.
- MAs can be used with other technical analysis tools, such as trend lines and oscillators, to help traders make more informed trading decisions.
Cons
- MAs are lagging indicators, meaning that they are based on past price data and may not provide the most timely signals.
- MAs may give false signals in choppy or range-bound markets where prices are not trending consistently in one direction.
- MAs do not consider fundamental analysis, such as economic news and events, which can significantly impact market movements.
- MAs should not be relied upon solely, as they do not consider all the factors affecting market movements.
2. Ichimoku Kinko Hyo
The Ichimoku Kinko Hyo, also known as the Ichimoku Cloud or simply the Ichimoku, is a technical analysis indicator that can be used in various trading strategies, including scalping.
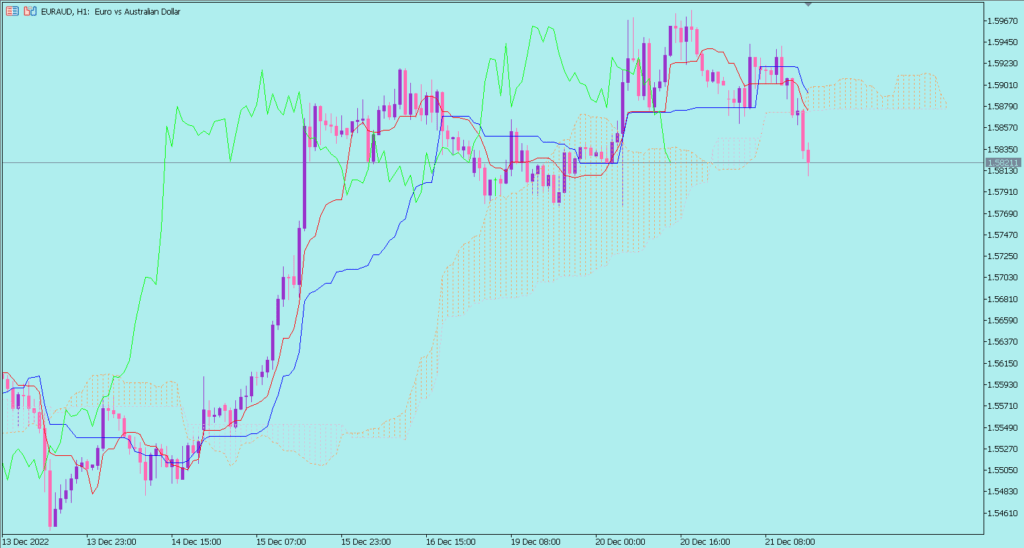
The Ichimoku is a comprehensive technical indicator that helps traders identify trends, assess the strength of a trend, and identify potential entry and exit points.
The Ichimoku consists of five lines: the tenkan-sen, the kijun-sen, the senkou span A, the senkou span B, and the chikou span.
These lines create a “cloud” on the chart, the shaded area between the senkou span A and senkou span B lines.
In a scalping strategy, the Ichimoku can identify short-term trends and potential entry and exit points.
For example, a trader may use the tenkan-sen and kijun-sen lines to identify the overall trend and the chikou span to confirm the trend’s strength.
The cloud can also be used to identify potential support and resistance levels.
However, it is important to note that the Ichimoku is a comprehensive indicator and may not be suitable for all traders.
Learning how to use the indicator effectively and interpret the various signals it generates may take some time.
As with any technical analysis tool, it is important to use the Ichimoku in conjunction with other analysis methods and with a good understanding of market dynamics.
Pros
- The Ichimoku is a comprehensive indicator that provides a wide range of information, including trend direction, trend strength, and potential support and resistance levels.
- The Ichimoku is easy to interpret, with clear buy and sell signals generated by the various lines.
- The Ichimoku can be used on any timeframe, making it suitable for traders of all timeframes, including scalpers.
- The Ichimoku can be used with other technical analysis tools and a good understanding of market dynamics to help traders make more informed trading decisions.
Cons
- The Ichimoku may be overwhelming for some traders, consisting of five separate lines and generating a wide range of signals.
- The Ichimoku may give false signals in choppy or range-bound markets, where prices are not trending consistently in one direction.
3. Bollinger Bands
Bollinger Bands are a technical analysis indicator that can be used in various trading strategies, including scalping.
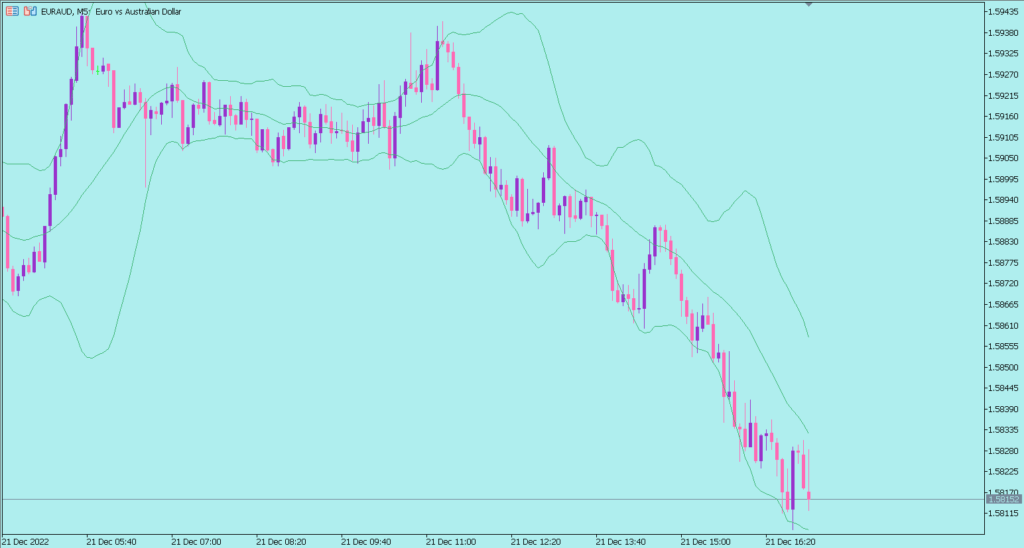
Bollinger Bands consist of a moving average, and two outer bands plotted at a standard deviation above and below the moving average.
The bands expand and contract based on the volatility of the underlying asset.
In a scalping strategy, Bollinger Bands can be used to identify potential entry and exit points.
For example, a trader may use the bands to identify overbought and oversold conditions, with the upper band indicating overbought conditions and the lower band indicating oversold conditions.
A trader may also look for a price breakout above or below the bands as a potential trading signal.
Pros
- Bollinger Bands are simple and easy to use, making them popular among traders of all experience levels.
- Bollinger Bands can help identify overbought and oversold conditions and potential trend reversals.
- Bollinger Bands can be used on any timeframe, making them suitable for traders of all timeframes, including scalpers.
- Bollinger Bands can be used with other technical analysis tools and a good understanding of market dynamics to help traders make more informed trading decisions.
Cons
- Bollinger Bands are a lagging indicator based on past price data and may not provide the most timely signals.
- Bollinger Bands may give false signals in choppy or range-bound markets, where prices are not trending consistently in one direction.
4. Relative Strength Index (RSI)
The relative strength index (RSI) is a technical analysis indicator that can be used in a variety of trading strategies, including scalping.
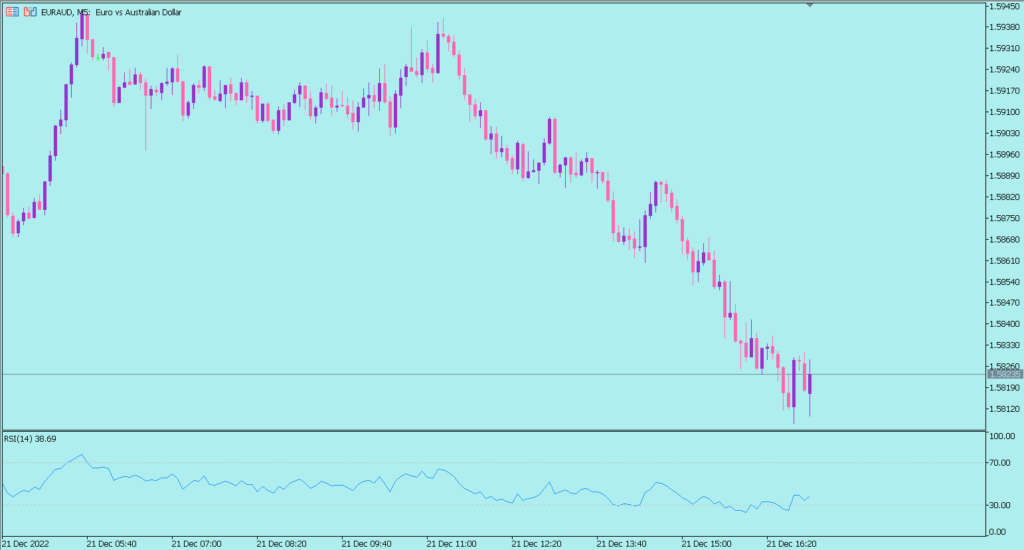
The RSI is a momentum oscillator that measures the strength of a trend by comparing the magnitude of recent gains to recent losses over a specified time period.
In a scalping strategy, the RSI can be used to identify overbought and oversold conditions and potential trend reversals.
For example, a trader may use the RSI to identify an overbought condition when the RSI is above 70 and an oversold condition when the RSI is below 30.
The RSI may also be used to confirm the strength of a trend by looking for divergences between the RSI and the underlying price action.
Pros
- The RSI can help traders identify overbought and oversold conditions and potential trend reversals.
- The RSI can be used to confirm the strength of a trend by looking for divergences between the RSI and the underlying price action.
- The RSI is easy to interpret, with clear buy and sell signals generated by the overbought and oversold levels.
- The RSI can be used on any timeframe, making it suitable for traders of all timeframes, including scalpers.
Cons
- The RSI is a lagging indicator, meaning that it is based on past price data and may not provide the most timely signals.
- The RSI may not work in strong trends.
- The RSI should not be relied upon solely, as it does not consider all the factors affecting market movements.
5. DeMarker (DeM)
The DeMarker (DeM) indicator is a technical analysis tool that can be used in various trading strategies, including scalping.
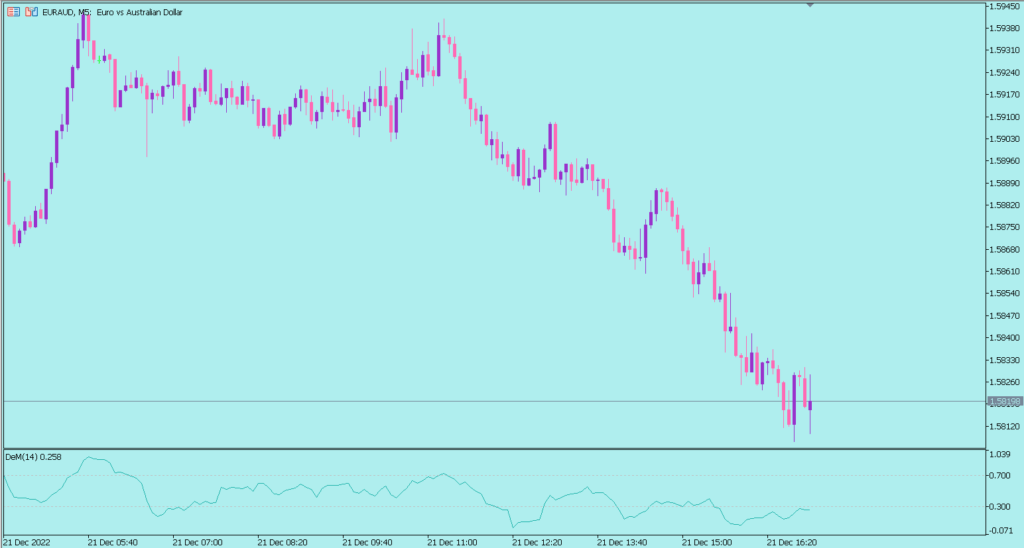
The DeM is a momentum oscillator that measures the strength of a trend by comparing the most recent high and low prices to the previous high and low prices.
In a scalping strategy, the DeM can be used to identify overbought and oversold conditions and potential trend reversals.
For example, a trader may use the DeM to identify an overbought condition when the DeM is above 0.7 and an oversold condition when the DeM is below 0.3.
The DeM may also be used to confirm the strength of a trend by looking for divergences between the DeM and the underlying price action.
Pros
- The DeM can help traders identify overbought and oversold conditions and potential trend reversals.
- The DeM can be used to confirm the strength of a trend by looking for divergences between the DeM and the underlying price action.
- The DeM is easy to interpret, with clear buy and sell signals generated by the overbought and oversold levels.
- The DeM can be used on any timeframe, making it suitable for traders of all timeframes, including scalpers.
Cons
- The DeM is a lagging indicator, meaning that it is based on past price data and may not provide the most timely signals.
- The DeM may give false signals in choppy or range-bound markets where prices are not trending consistently in one direction.
Bonus: Forex scalping indicators
Here are some bonus tips for forex scalping:
Use a low timeframe chart:
Scalping involves taking advantage of very small price movements, so using a chart with a short timeframe, such as a 1-minute or 5-minute chart, is important.
Choose a liquid currency pair:
It is important to trade a currency pair with high liquidity, as this will allow you to enter and exit trades quickly and with minimal slippage.
Use a stop-loss:
Scalping involves taking on a high level of risk, so it is important to use a stop-loss to limit potential losses. A stop-loss is an order to sell a currency pair when it reaches a certain price, which helps to protect against unexpected price movements.
High risk:
Scalping involves taking on a high level of risk, so it is important to use a stop-loss to limit potential losses. A stop-loss is an order to sell a currency pair when it reaches a certain price, which helps to protect against unexpected price movements.
Use technical analysis:
Scalping strategies often rely on technical analysis tools, such as moving averages, Bollinger Bands, and oscillators, to identify potential entry and exit points.
Use a risk-management strategy:
It is important to have a risk-management strategy to ensure that you are not taking on too much risk. This may include using a stop-loss and limiting the percentage of your account you are willing to risk on each trade.
Stay up-to-date with market news:
It is important to stay informed about market news and events that can affect the forex market, as these can significantly impact price movements.
Practice good risk management:
Scalping involves taking on a high level of risk. So, it is important to use good risk management practices, such as limiting the percentage of your account that you are willing to risk on each trade and using a stop-loss to protect against unexpected price movements.
It is important to note that scalping is a high-risk, high-reward strategy and may not be suitable for all traders. It is essential to have a good understanding of the markets and to be able to make quick, informed decisions to succeed with scalping.
FAQs
Can I increase success probability with Forex indicators?
There is no concrete answer to this question. The odds of success increase if you test the indicator with different settings and run both back and forward tests.
What is the best timeframe to use any indicator?
For scalping, 1-minute and 5-minute timeframes are the best. However, it also depends on what indicator you use.
Is it better to use price action for scalping?
Price action always has the edge over using the lagging indicators. However, every approach is subjective.
Can I use these indicators for swing trading as well?
These indicators can be used in any timeframe. You have to adjust your risk accordingly.
What is the healthiest winning rate in scalping?
If you have risk-to-reward ratio 1:2, then 60% winning rate is quite healthy.